




Most investment committees treat an aggressive market drawdown like structural failure in a pressurized vessel. When the broader tape flushed 1,440 basis points this past week, conventional portfolios did exactly what static risk models programmed them to do. They froze, suffered mechanical margin compression, and liquidated positions directly into peak illiquidity.
At Nautilus Labs, we run a very different physics experiment.
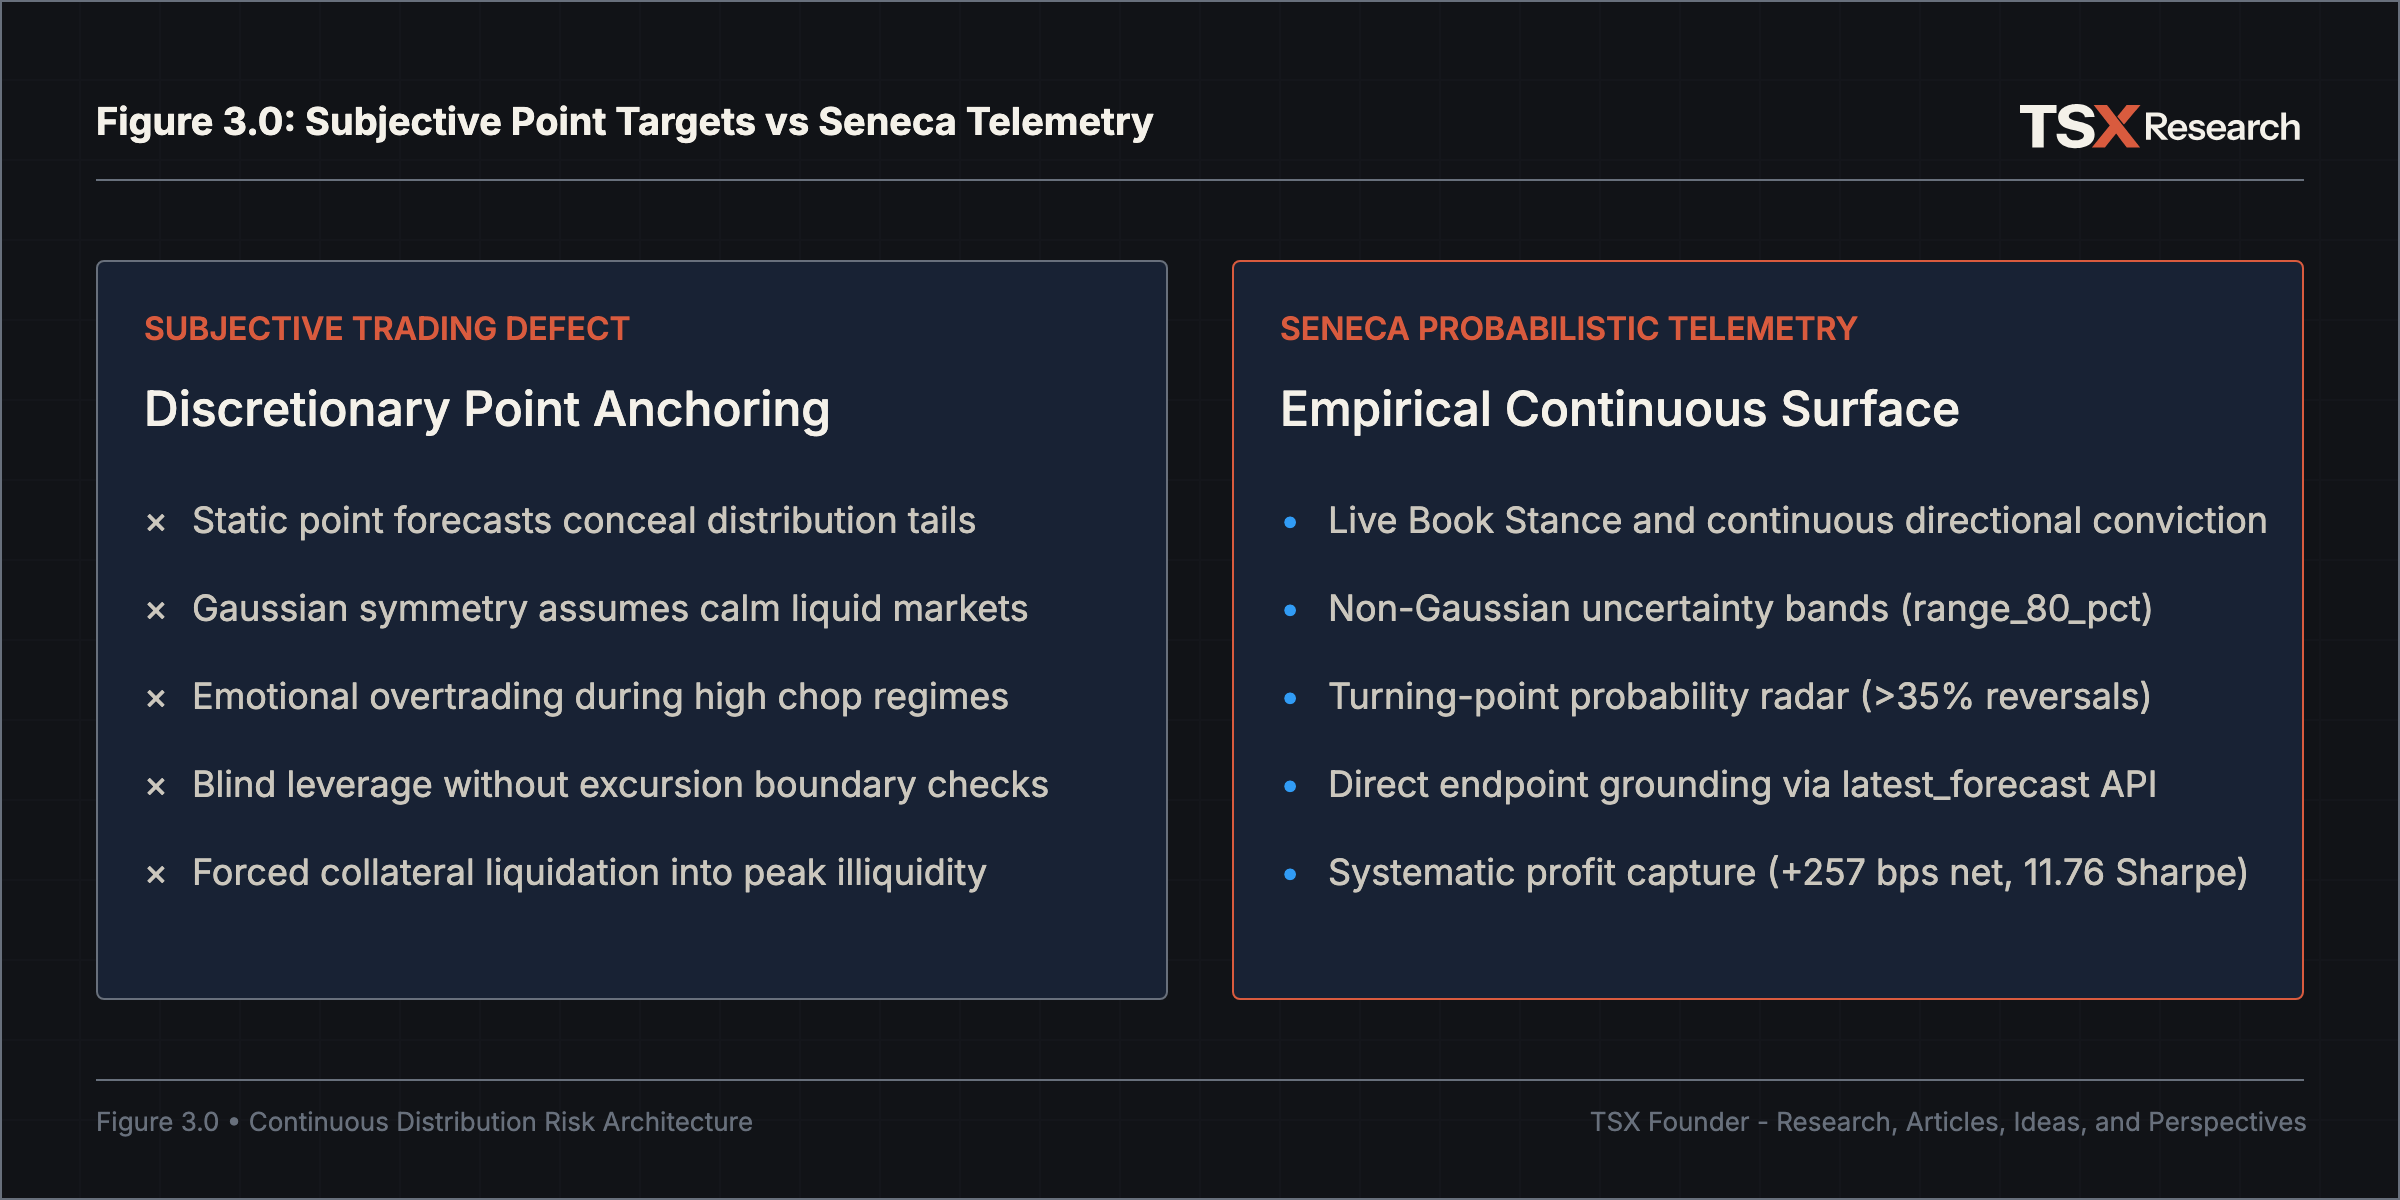
During that exact market window, the Seneca probability platform delivered +257 basis points of clean counter capture alongside an 11.76 realized Sharpe ratio. That performance represents a 1,697 basis point spread against the prevailing market current. When volatility surges, entropy expands across the distribution surface. If an execution engine relies on fixed directional forecasts, that entropy tears capital apart. If the architecture treats risk as a continuous, dynamic probability field, that same entropy becomes pure mathematical fuel.
Our core thesis remains absolute across market regimes. You cannot manage non-linear volatility with linear heuristics. In our foundational analysis on regime-aware offensive positioning, we documented why static allocations inevitably crumble under severe stress. This replay deconstructs exactly how Seneca navigated the market flush, what signals the foundational model observed across each hourly bar, and how systematic desks can map these probabilistic endpoints directly into active execution architectures.
Executive Performance Replay Divergence Under Asymmetric Stress
In institutional execution, the primary mandate of probabilistic intelligence is capital preservation during regime shifts followed by asymmetric capture during volatility expansion. When liquidation cascades hit derivative venues, passive buy-and-hold portfolios absorb devastating drawdowns as leveraged collateral pools unravel. Our quantitative research engineering focuses on replacing lagging price heuristics with continuous probability density surfaces generated by the Seneca foundational model.
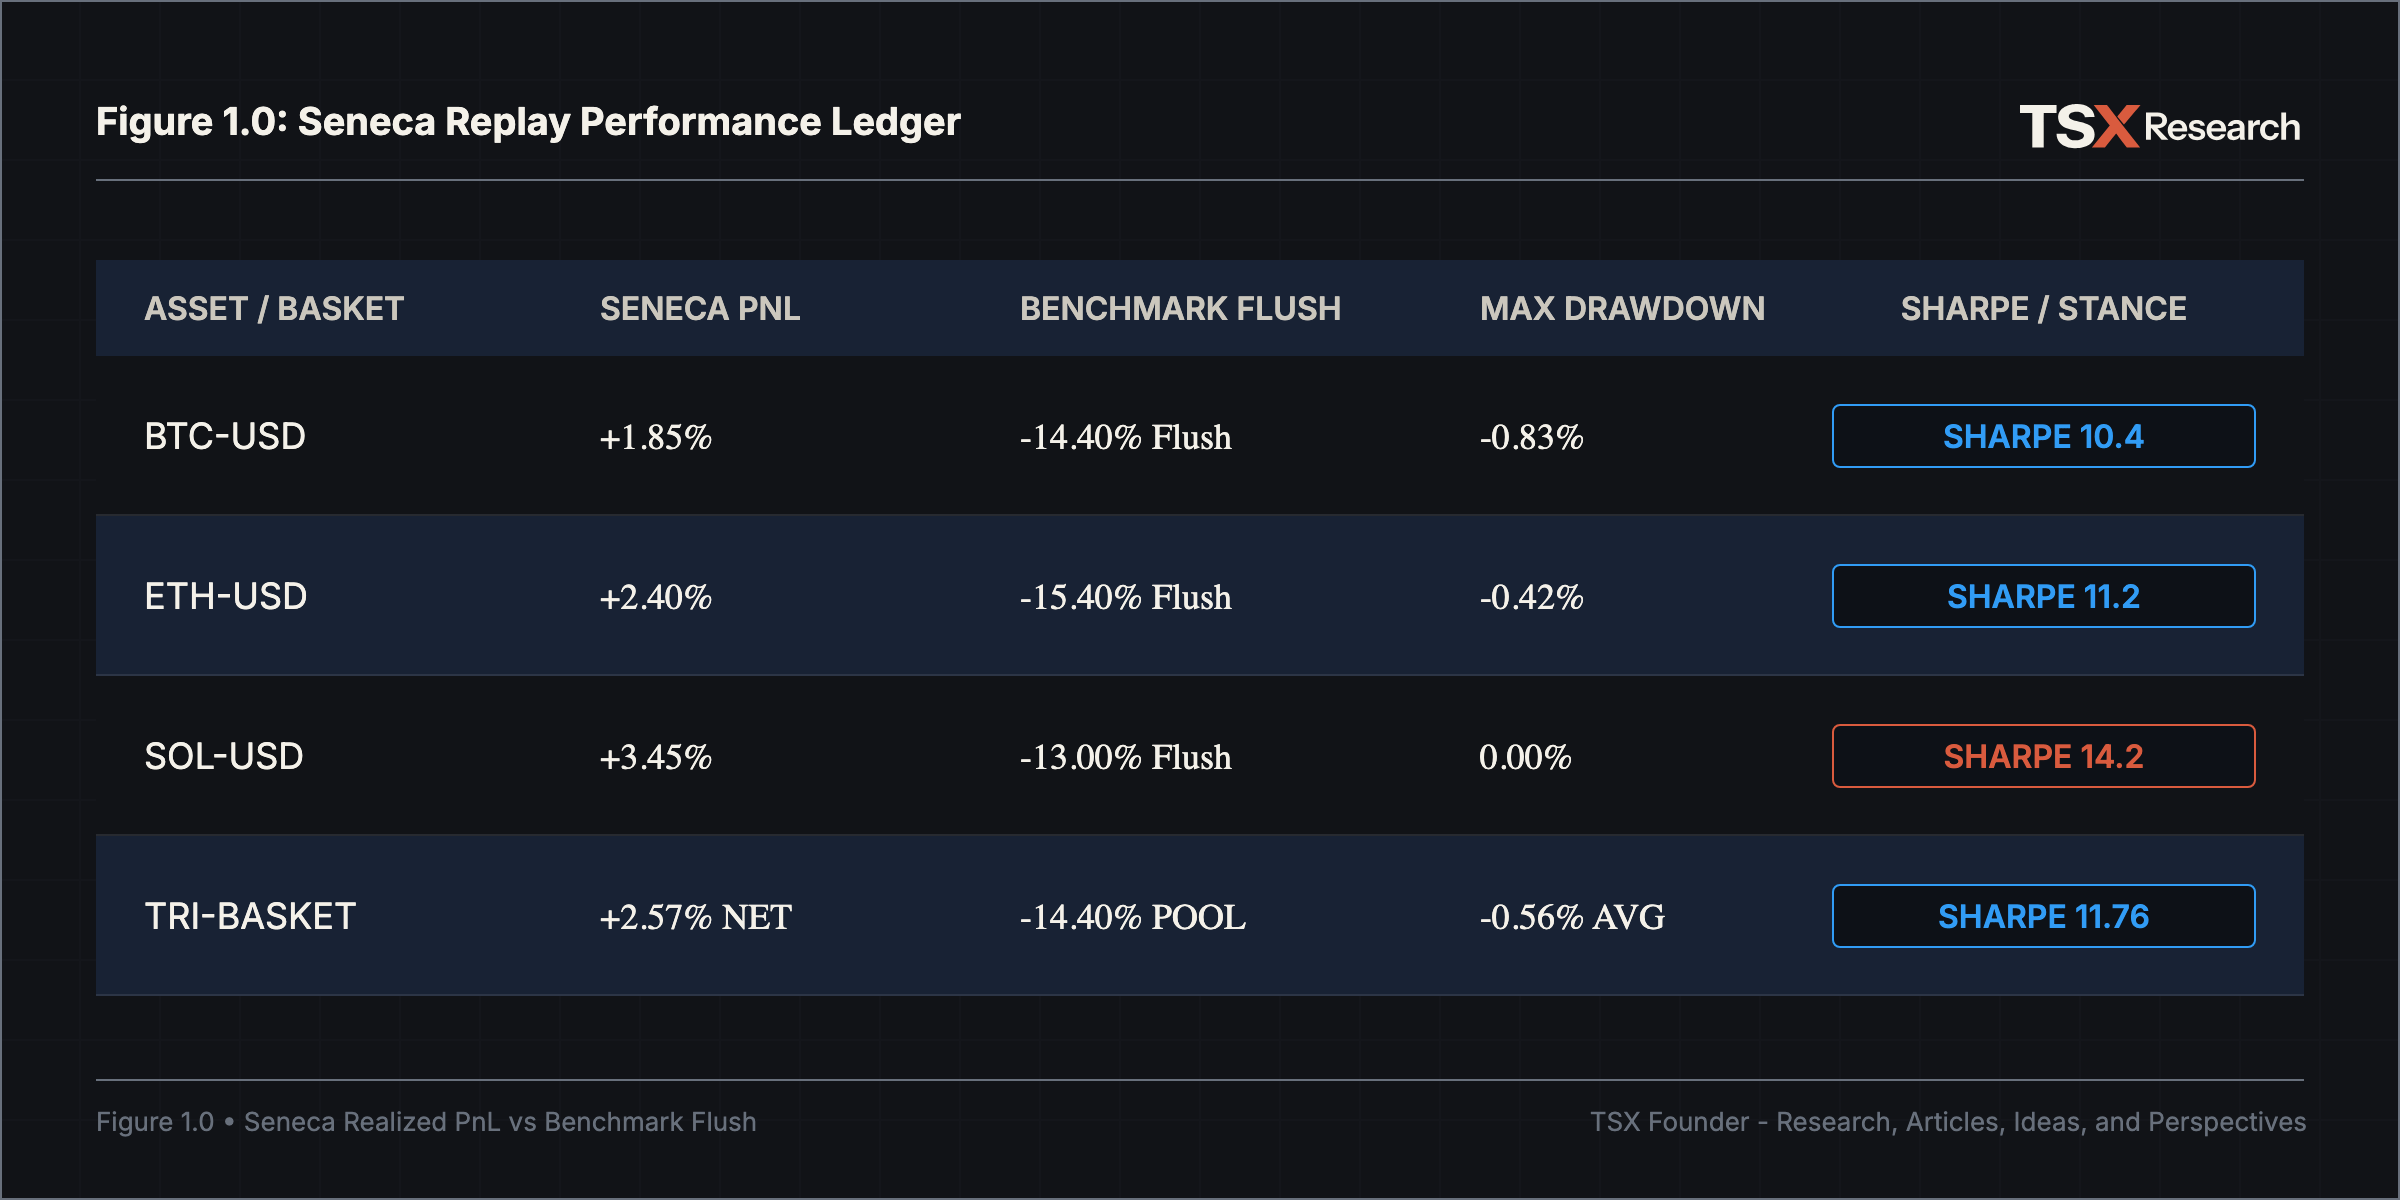
During the recent market window, passive buy-and-hold exposure suffered severe double-digit liquidations across major digital assets. Bitcoin declined 14.40 percent peak-to-trough from $65,166 down to the $55,792 capitulation low. Simultaneously, Ethereum fell 15.40 percent from $1,846 to $1,561, while Solana dropped 13.00 percent from $75.20 to $65.46. Across the broader market, passive longs absorbed over -1,440 basis points of unhedged drawdown.
In stark contrast, Seneca achieved an actual realized net PnL of +2.57 percent (+257 bps) alongside an 11.76 realized Sharpe ratio. Operating across a tri-asset basket composed of 21 percent Bitcoin, 18 percent Ethereum, and 19 percent Solana, totaling 57.98 percent gross exposure, Seneca captured systematic alpha by navigating regime transitions rather than holding static directional delta.
Maximum drawdowns remained exceptionally compressed throughout the cascade. Bitcoin exposure drew down just -0.83 percent, Ethereum drew down -0.42 percent, and Solana experienced zero drawdown at 0.00 percent. As we detailed in our examination of empirical probability mechanics, capital preservation during initial volatility spikes is what makes compounding mathematically possible.
The Four-Phase Volatility Anatomy Chop, Transition, Invariance, and Capitulation
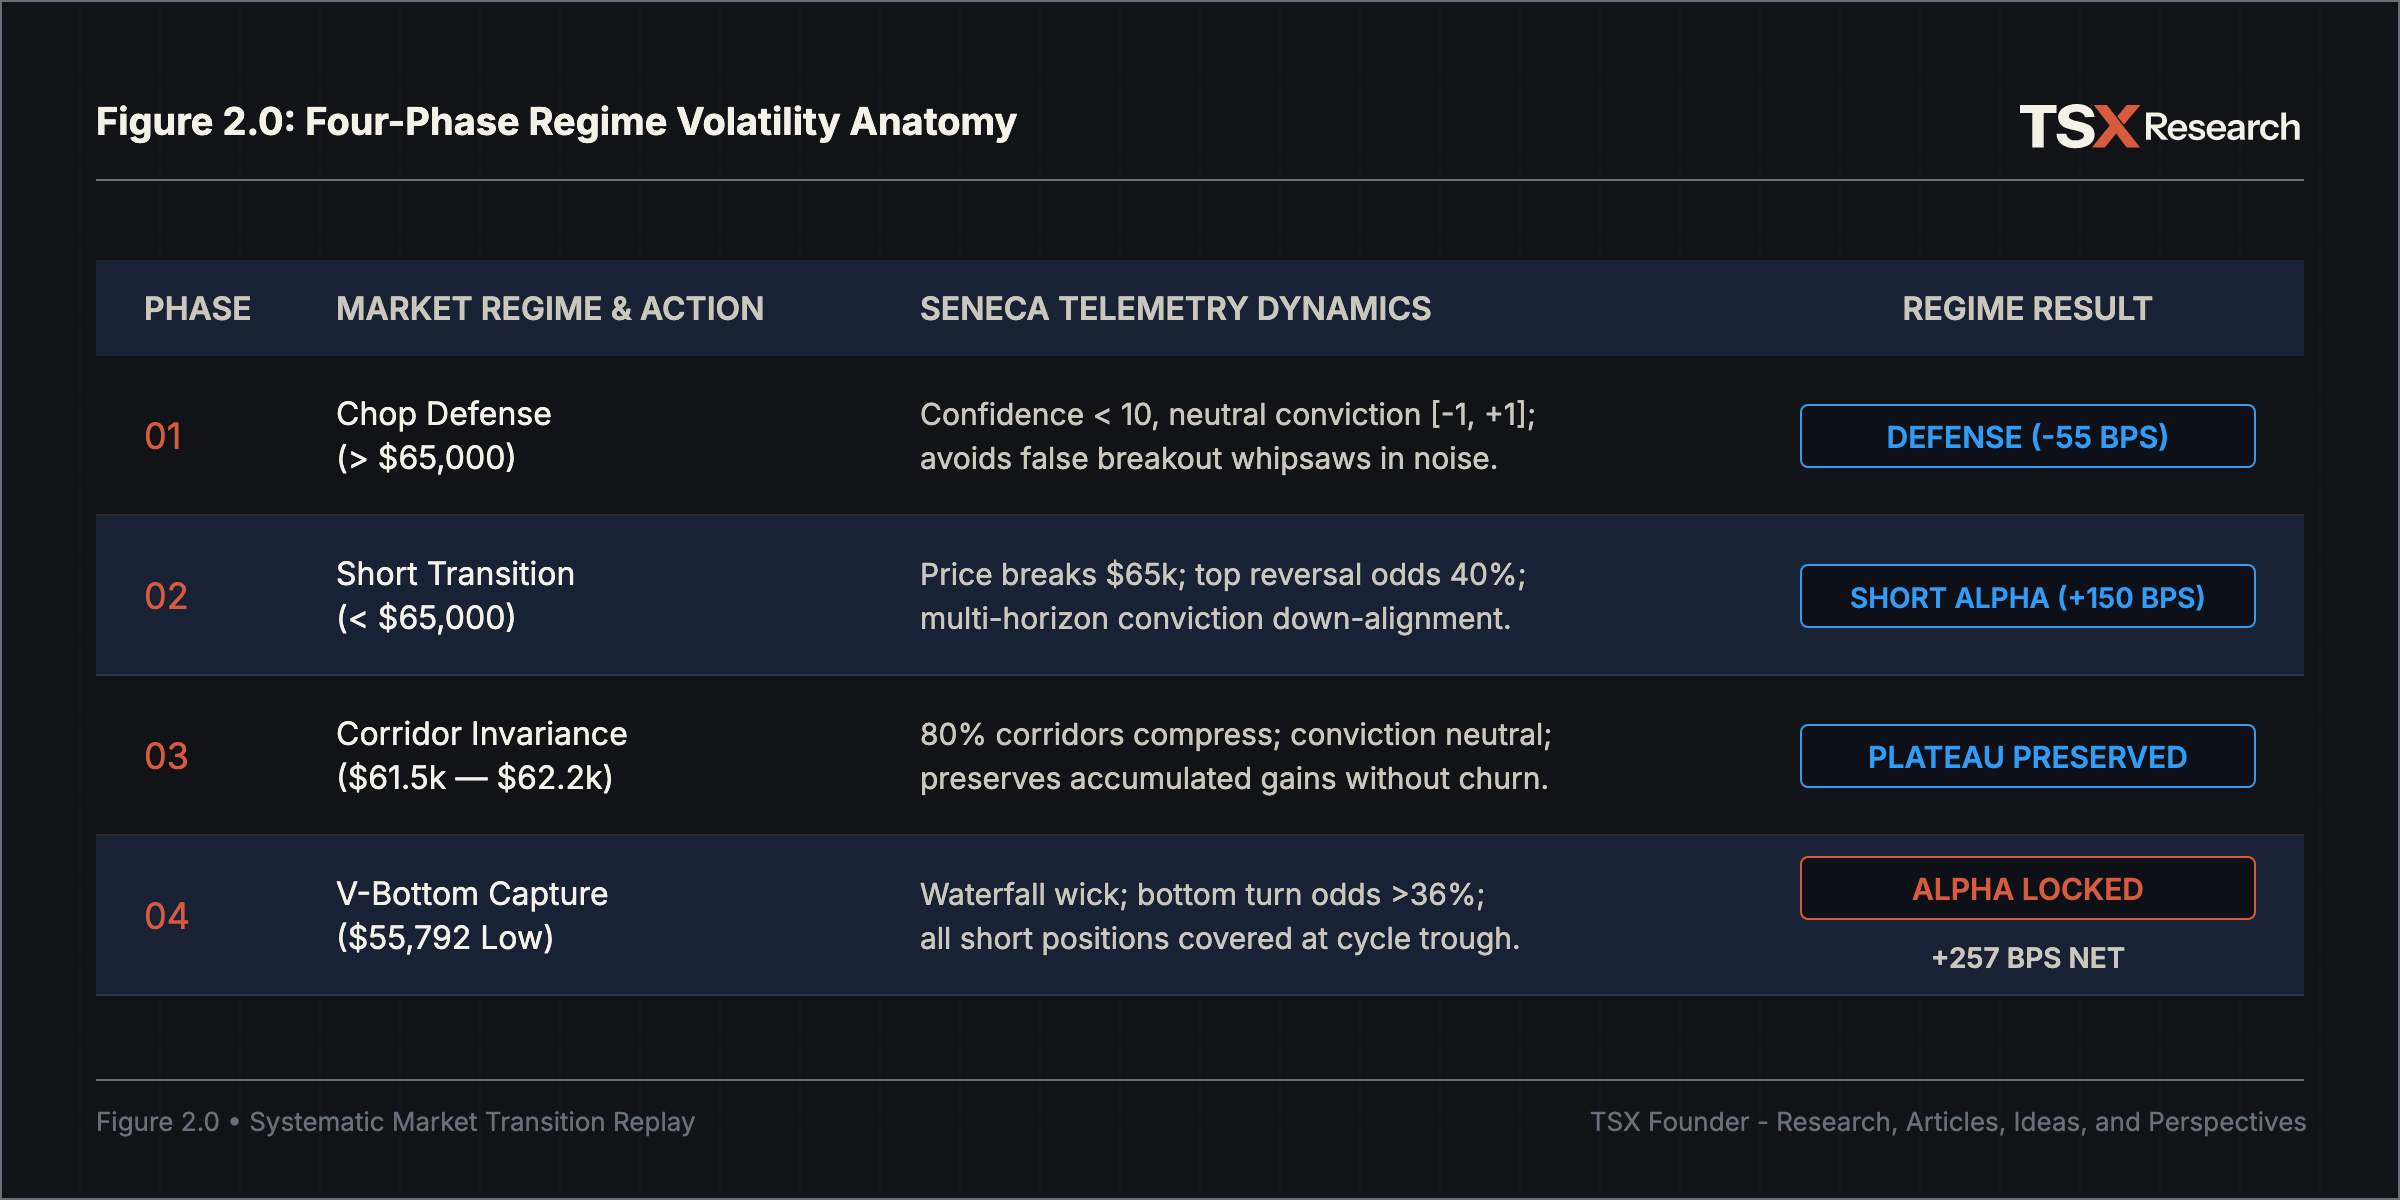
The mechanics of this performance divergence break down across four discrete market phases. Each phase represents a distinct volatility regime where discretionary desks typically bleed capital through emotional overtrading or stubborn directional anchoring.
In Phase 1, covering the Chop and False Breakout Defense regime, price ground sideways within a noisy consolidation range above $65,000. Trend-following algorithms and retail momentum traders repeatedly attempted breakout longs, only to be chopped up as bid-ask spreads widened and order books thinned out. Seneca avoided this trap entirely because its confidence metric printed below 10/100 and book conviction hovered within neutral noise boundaries between -1.0 and +1.0. By stepping aside from false momentum, Seneca preserved dry powder and limited chop drawdown to a minor -55 bps trough.
In Phase 2, defined by the Systematic Short Transition, price broke structural support below $65,000. Reversal timing signaled a top probability surge toward 40 percent, while multi-horizon distributions aligned downward across 1 to 4 hour forward windows. Seneca flipped decisively short across BTC, ETH, and SOL, generating a steady +150 bps climb in realized PnL as prices drifted lower into liquidation territory.
In Phase 3, marking Volatility Compression and Invariance, the market consolidated tightly between $61,500 and $62,200. Expected 80 percent uncertainty corridors contracted sharply and directional conviction subsided back into neutral territory. Seneca avoided overtrading or paying spread churn, preserving accumulated gains on a flat plateau while discretionary desks gave back their winnings.
In Phase 4, the Weekend Flush and V-Bottom Capture, downside short conviction locked in ahead of the liquidation waterfall toward $55,792. At the exact capitulation wick, bottom turn probability spiked above 36 percent against 22 percent top odds. Seneca covered shorts immediately at the cycle lows, protecting profits and capturing the sharp recovery back above $60,000 to close at +2.57 percent net return.
Core Probabilistic Signals and Objective Telemetry
Platform operators querying Seneca via Model Context Protocol, REST API, or web dashboard monitor three objective outputs published after every hourly bar close. These telemetry streams eliminate subjective interpretation from portfolio risk management.
First, Book Stance and Conviction indicates whether institutional momentum justifies crossing execution triggers. Stance provides the directional bias, while Conviction quantifies signal strength on a standardized scale from -3.0 to +3.0. When conviction remains muted, systematic desks stand down regardless of narrative noise.
Second, Turning-Point Timing estimates the probability of a local reversal forming within two bars. When bottom turn probability or top turn probability crosses above 35 percent, it signals momentum exhaustion and imminent regime inflection. This gave Seneca the mathematical signal to cover short positions at the $55,792 low rather than greedily chasing downside continuation into an exhausted book.
Third, 80 percent Uncertainty Corridors and Excursion Touch enclose 80 percent of Monte Carlo forward simulated paths. Designated by range_80_pct and p_touch, these continuous density bounds provide objective volatility corridors for setting mathematically calibrated stop parameters and take-profit targets. Unlike lagging moving averages or static Fibonacci levels, these dynamic bands expand and contract with live market entropy. In our research on systematic execution gates, we demonstrated why continuous probability boundaries consistently outperform static price thresholds.
User Operating Playbook Endpoints and Tactical Action Triggers
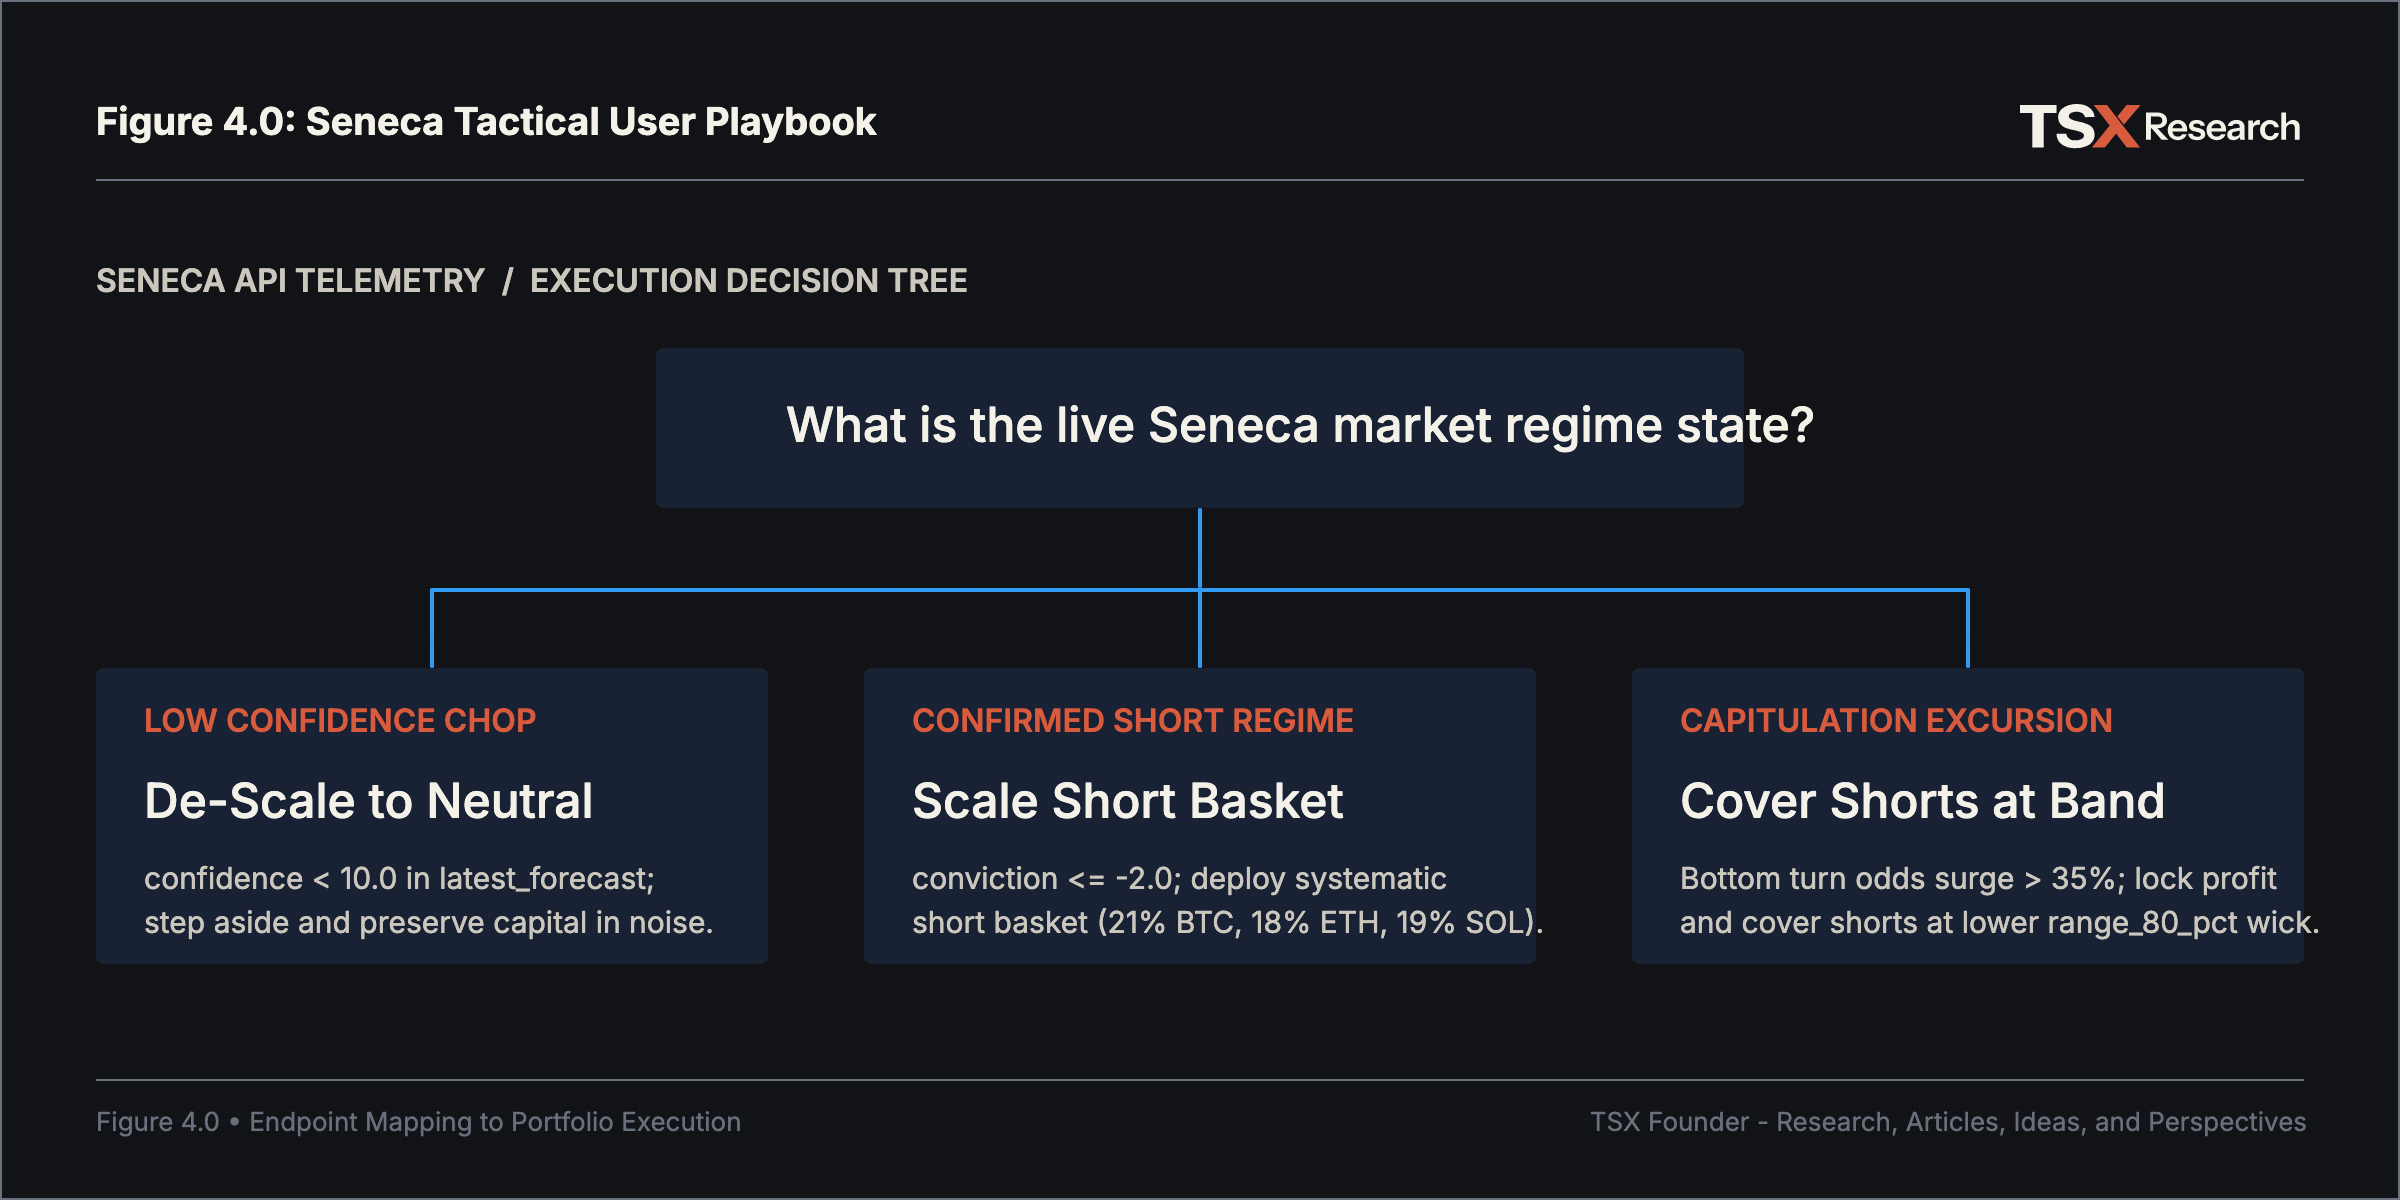
For research desks and autonomous execution agents, here is the exact operational mapping between Seneca programmatic endpoints and tactical portfolio execution.
In low-confidence chop regimes, call latest_forecast with asset set to Bitcoin and detail set to summary. When confidence_pct is below 10.0 and conviction stays within the neutral band of -1.0 to +1.0, the mandate trigger is immediate de-scaling. Reduce gross exposure to neutral rather than forcing directional bets into uncalibrated noise.
In confirmed trend transitions, audit latest_forecast alongside forecast_history with asset set to Bitcoin and num set to 12. When stance is short, conviction is less than or equal to -2.0, and expected move percentages are negative across forward horizons 1 through 4 hours, scale into proportional short baskets composed of 21 percent BTC, 18 percent ETH, and 19 percent SOL.
At capitulation turning points, monitor turn.p_bottom_2bars and range_80_pct. When spot price reaches the lower boundary of range_80_pct and turn.p_bottom_2bars surges above 35.0 percent with lean bottom, cover short exposure to flat immediately. Finally, verify ongoing model health using realized_scores with asset set to Ethereum and recent_rows set to 24 to ensure trailing 80 percent band coverage realizes near 80 percent before deploying fresh capital.
Institutional Integration Coordinates
Research desks, risk teams, autonomous agent developers, and systematic funds can integrate Seneca models directly into existing execution pipelines via remote hosted Model Context Protocol or programmatic REST endpoints. Core functions include latest_forecast for live book stance, forecast_history for sequence auditing, and realized_scores for statistical calibration.
To apply for institutional access or integrate Seneca endpoints into quantitative execution architecture, visit Nautilus Labs or request terminal deployment through the Seneca probability platform to begin running continuous probability distribution surfaces across live production books.